7.38 Normal Peaks and Spectral Peaks: Display Basics
Audio media items in arrange view are normally displayed as waveforms only based on dB levels.
Kind: concept (user-guide-section) Chapter: 7 Managing and Editing Media Items Source: REAPER User Guide v7.70
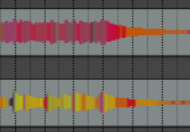
Audio media items in arrange view are normally displayed as waveforms only based on dB levels. You can change this to a spectral display in which the media item is colored according to its audio frequencies, and in particular the most dominant frequency as it changes thru time. An example is shown here (right). Note that it is a diagnostic tool, designed to help identify and resolve issues in your mix. It is not a silver bullet, nor does is it offer an instant fix for all your problems. Nor is it intended that your eyes should replace your ears! By viewing your waveforms as a range of colors, you might more readily be able to identify critical frequencies, especially where your ears are already telling you that you have a problem, or at least a decision to make. Spectral peaks can be helpful in recognizing content. For example, the lower and upper registers of a clarinet will show as different colors. A flute will be different again. Some other possible uses are:
- To identify and pinpoint precisely unwanted noise (such as low
end hum), or frequency spikes that you can hear in a track, or a particular event in a track, such as a percussion hit.
- To identify the precise location of a note (e.g. when a distorted
guitar has been recorded).
- To check the frequency at which a track's sounds are peaking for
possible conflict with other tracks, or to identify precisely where frequencies may need to be EQ'd.
- To check (for example) bass instruments for notes that are too quiet or too loud.
You can learn more about these concepts here www.mat.ucsb.edu/~b.sturm/MAT201A/presentations/Fri/OhnandPark.pdf:
The command Options, Peak display mode gives you eleven options for choosing how peaks are to be displayed, a further option to Scale peaks by squqare root (half of range is 12 dBb rather than 6 dBb), and the option to open your Peak Display Settings. The eleven display options are also available from within the peak display settings window (as shown below), Use the Options, Peak display mode, Show spectral peaks command to turn the display of spectral peaks on and Options, Peak display mode, Normal peaks to turn them off. Another peaks display mode option is Spectrogram: this will be considered in the next section.
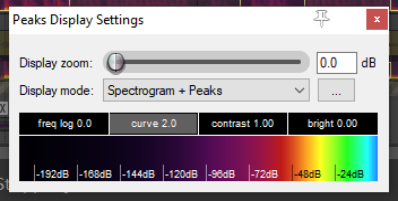
View, Peaks Display Settings opens this window (right).
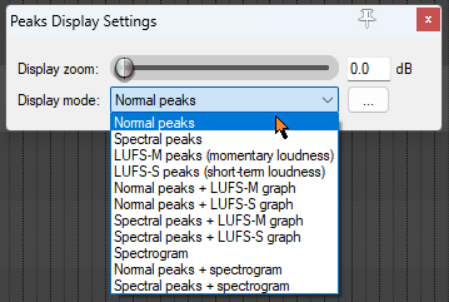
- Display mode modes are shown here (below right). These include Normal Peaks, Spectral Peaks, Momentary loudness and Short term loudness. These last two are explored and explained at the end of this chapter. There are also options to display various permutations, such as Normal Peaks with Momentary Loudness
- There are options to (… menu) Scale peaks by sq root and to Open peak generation and caching sdettings/.
- The Display gain slider can be used to increase or decrease the peak height, but do not affect volume.
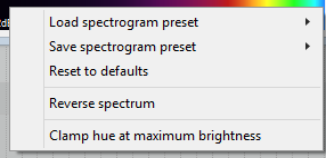
- In any mode except Peaks, right-click on the color display to open a context menu. Options are available to save, load, rename loudness view presets. Fade non-tonal content to theme peaks color: the color of audio that is completely tonal will be determined by the frequency: noise will be the same color as that assigned to the normal peak. In most cases, this will result in a blend of the two.
- In Spectrogram+peaks mode the four horizontal controls freq log, curve, contrast, and bright can be used to modify the display – e.g. to emphasise low frequencies, drag the freq log fader fully to the right. Enabling spectral peaks will roughly double peak file size. Generating these peaks uses a lot of RAM, especially if
spectral peaks are displayed while recording. Spectral peaks can be enabled/disabled on a per track basis via a Track performance option (Prevent spectral peaks/spectrograms) on the right-click TCP context menu. Shown here (right) is an example where Normal peaks + LUFS-M graph has been selected. Options on the Media**, Peaks Generation** page of Preferences which affect spectral peak behaviour include several options to specify in which circumstances spectral peaks should or should not be generated.