The Oscilloscope Meter
An oscilloscope displays and analyzes the waveform of electronic signals.
Kind: concept (effect-summary) Source: REAPER Effects Summary Guide v3.04
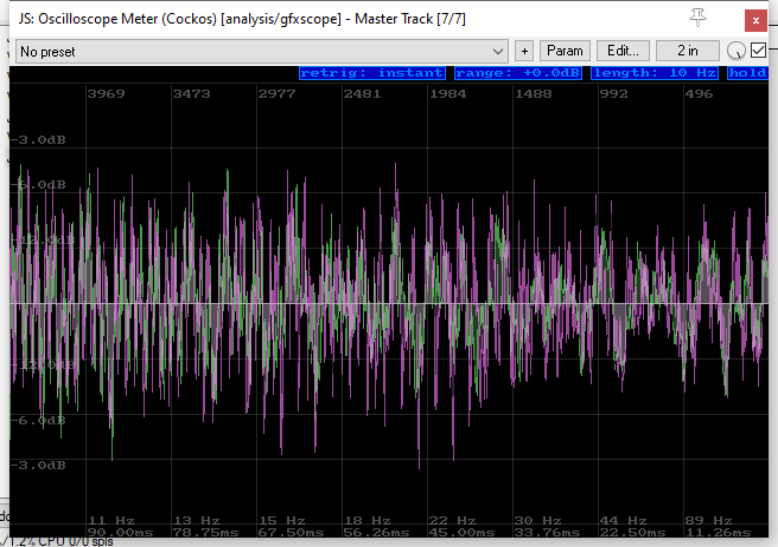
An oscilloscope displays and analyzes the waveform of electronic signals. While the track is playing it displays a graph which depicts instantaneous signal voltage across time. The visible waveform can then be subjected to analysis, for example, of aspects such as frequency, amplitude and time intervals. As with the spectrum analyzer, frequency is plotted on the horizontal axis and bandwidth on the vertical axis.
Retrig Triggering is the process of synchronizing the horizontal sweep of the oscilloscope with the proper point of the signal being analyzed. This control can be set to determine whether a signal is triggered on ascending flank or descending flank, or instantly, or by any. Click on this control to cycle between options.
Range This determines the limits of the dB range displayed in the chart. The default setting is 0.0 dB but this can be modified. Click-hold-drag over this control, upwards or downwards to change the range setting as required. Double click to return to the default setting.
Length This determines the length displayed in the chart. The default is 10 Hz. Click-hold-drag up or down to change this.
Hold Click and hold the mouse button down to temporarily freeze the on screen display. Click-hold-drag down to keep the display frozen, and down further to0 display earlier samples. Click again to “unfreeze” the display.