Spectrograph Meter
The JS Spectrograph Meter is a spectrogram.
Kind: concept (effect-summary) Source: REAPER Effects Summary Guide v3.04
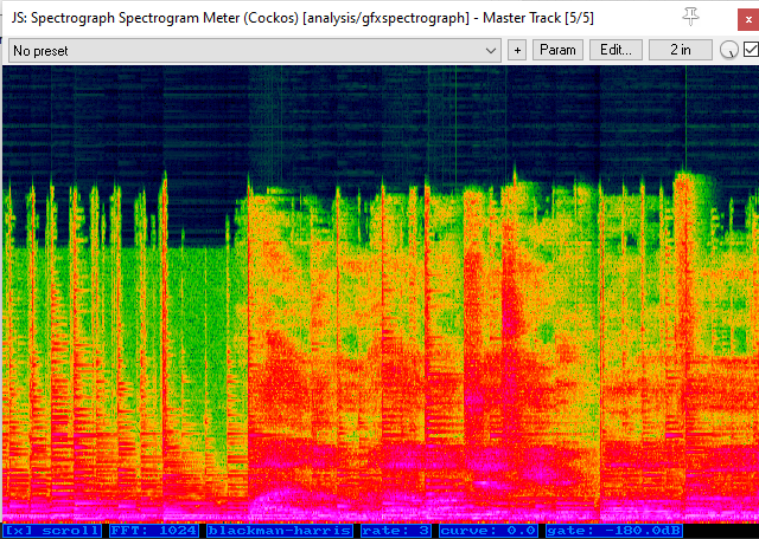
The JS Spectrograph Meter is a spectrogram. It uses color to represent the frequencies in an audio signal as they vary thru time. Its controls are as follows:
Scroll Click to enable/disable this option. When enabled, the display will scroll from right to left as thetrack is played.
FFT size The FFT size settings determines which algorithm is used to compute the display. A higher FFT size will give you better frequency resolution. This can be preferred when you are trying to identify low-frequency sounds such as plosives or mic handling noise. A lower FFT setting will give you better time resolution and is more useful when needing to identify high frequency events, or when working with transient, percussive signals. The default setting is 1024. Click and drag up or down to change this.
Windowing function You have a choice of which windowing function you want applied in performing FFT analysis. These are blackmanharris, blackman, rectangular or hamming. The default is blackman-harris.
Rate Determines the speed at which the spectograph display progresses. Right click for a menu range of 1 to 8.where 1 is the slowest and 8 is the fastest. If you require faster speeds, click and drag up over the word rate for an available range of 1 to 40.
Curve This setting determines at which frequency a curve will be plotted. Adjusting this will control whether frequencies are displayed linearly (curve=0), or if more pixels will be allocated to lower frequencies
Gate Sets the floor of the noise gate. Amplitudes of frequencies under this value will be drawn as black.
Scroll, FFT size, Window and Rate can also be modified from the context menu – right click over any part of the display.