The Frequency Spectrum Analyzer
Frequency analyzers are used to model the frequency spectrum of audio signals in such a way as to depict visibly various elements of the signal such as distortion and harmonics.
Kind: concept (effect-summary) Source: REAPER Effects Summary Guide v3.04
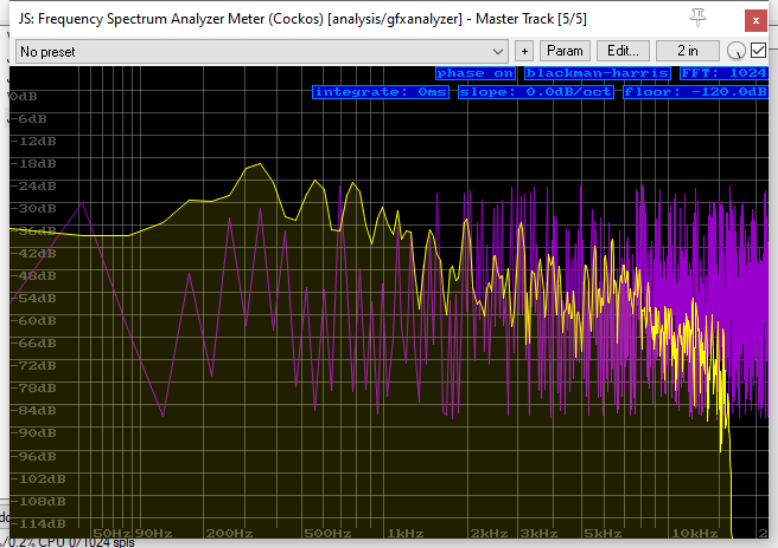
Frequency analyzers are used to model the frequency spectrum of audio signals in such a way as to depict visibly various elements of the signal such as distortion and harmonics. Frequency is plotted on the horizontal axis and bandwidth on the vertical axis. The Frequency Spectrum Analyzer controls are:
Phase A toggle: click to determine whether phase noise is displayed or not.
Windowing functions Right-click for a menu with a choice of windowing functions. You have a choice of which windowing function you want applied in performing FFT analysis. These are blackman-harris, blackman, rectangular or hamming. The default is blackman-harris.
Fast Fourier Transform (FFT) size Right click for a menu to select ant FFT size between 16 and 32768. We're entering a complex world of mathematics here, and unfortunately there's no easy way to explain fourier transform to the uninitiated in a few words! As a starting point, think of it as being a technique that analyzes a signal by deconstructing it into the frequencies that make that signal up. One use for this is to make the analysis of that signal easier. Changing the FFT size changes CPU usage: a larger FFT size provides more frequency resolution, however it also reduces the time resolution, meaning that more samples are used for analysis. You get more of an average of a longer period of time. A larger FFT also makes the graph inherently slower to react to changes in the input signal.
Integrate 7The default setting is 0 milliseconds (0 ms). Click and drag up to increase this, down to lower it again. At higher settings the display will slow down and smooth out. Double-click to restore the default setting.
Slope Click-drag here to set the slope within a range of 0 dB to 12 dB per ocave.
Floor This setting determines the quietest extent of the graph. The default is -120 dB. Click-hold-drag down to increase this range, or up to reduce it. Double-click to restore the default setting.
If you're technically minded and want to understand these concepts a bit better, read the notes on the next page.